Showing posts with label Forex Analysis. Show all posts

Monday, April 20, 2015

Price & Time: High Volume Liquidation in USD/CAD


Talking Points
  • USD/JPY flirting with important downside pivots
  • GBP/USD near key Fib zone
  • USD/CAD breaks multi-week range
Get real time volume on your charts for free. Click HERE
Foreign Exchange Price & Time at a Glance:
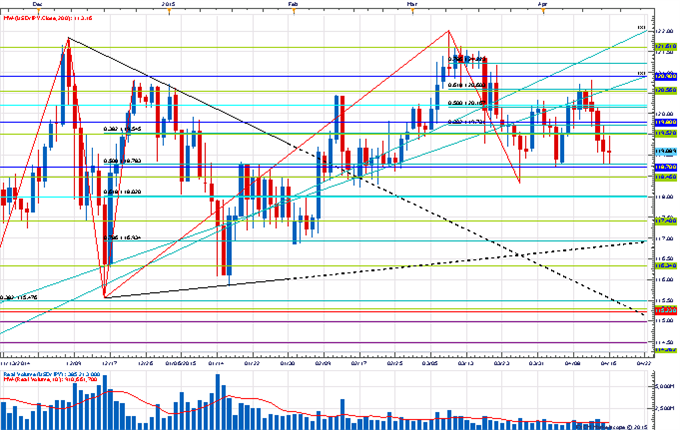
Price & Time Analysis: USD/JPY
Price & Time: High Volume Liquidation in USD/CAD
Charts Created using Marketscope – Prepared by Kristian Kerr
  • USD/JPY has come under steady pressure since failing near the 61.8% retracement of the March range at the start of the week
  • Our near-term trend bias is lower while below 120.90
  • Gann levels at 118.70 and 118.40 look critical and a move below them is needed to spark a more serious decline
  • A minor turn window is eyed today/tomorrow
  • Only a move through 120.90 would turn us positive on the exchange rate
USD/JPY Strategy: Like the short side while under 120.90.
Instrument
Support 2
Support 1
Spot
Resistance 1
Resistance 2
USD/JPY
*118.40
118.70
119.10
119.50
*120.90
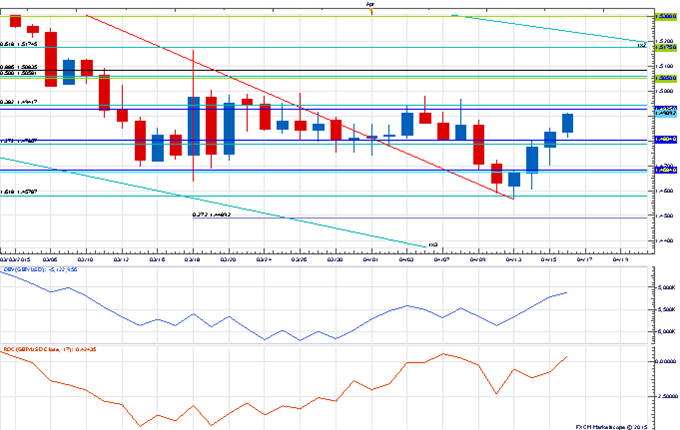
Price & Time Analysis: GBP/USD
Price & Time: High Volume Liquidation in USD/CAD
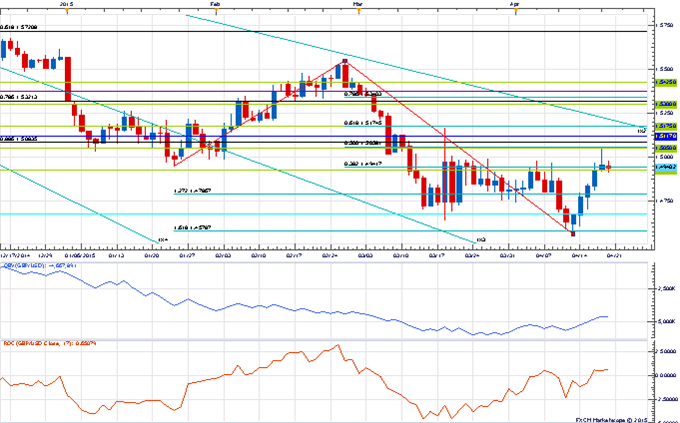
Charts Created using Marketscope – Prepared by Kristian Kerr
  • GBP/USD has traded steadily higher since finding support earlier this week at the 261.8% extension of the January/February advance
  • Our near-term trend bias is now higher in Cable
  • The 38% retracement of the February/April decline at 1.4940 looks to be a key pivot with traction above needed to spark a more important leg higher
  • A very minor turn window is eyed tomorrow
  • A daily close under 1.4680 would turn us negative on the pound
GBP/USD Strategy: Looking to buy on weakness.
Instrument
Support 2
Support 1
Spot
Resistance 1
Resistance 2
GBP/USD
*1.4680
1.4800
1.4915
*1.4940
1.5050
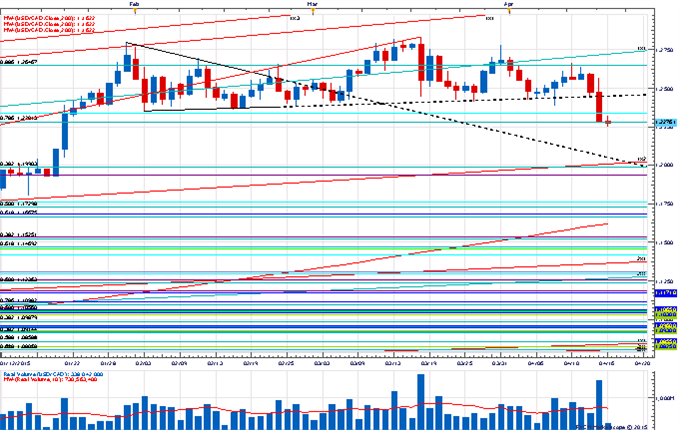
Focus Chart of the Day: USD/CAD
Price & Time: High Volume Liquidation in USD/CAD
We have been suspicious of the action in USD/CAD since the dramatic reversal on the FOMC decision last month. It was one of the widest daily ranges in years on some of the highest volume in years. A textbook sign of exhaustion – especially after just eeking out a new high. Our fears were realized yesterday as the February lows were breached leading to another high volume liquidation. We can only assume that this decline has more to run given the clear potential overhang of “stale longs” after several weeks of range trade. Another interpretation of the price action is that a head & shoulders pattern has been triggered on the move through 1.2450. If this is the case, it could open the way for a move to 1.2000. We shall see. It is USD/CAD after all and a curve ball or two is the rule not the exception. Immediate resistance is seen at 1.2350 and 1.2450, but only a move over 1.2665 would turn the technical outlook positive.

The Weekly Volume Report: Dollar Trying To Turn?

Talking Points
  • EUR/USD moves up on high volume
  • USD/CAD sees dramatic increase in turnover
Get real time volume on your charts for free. Click HERE
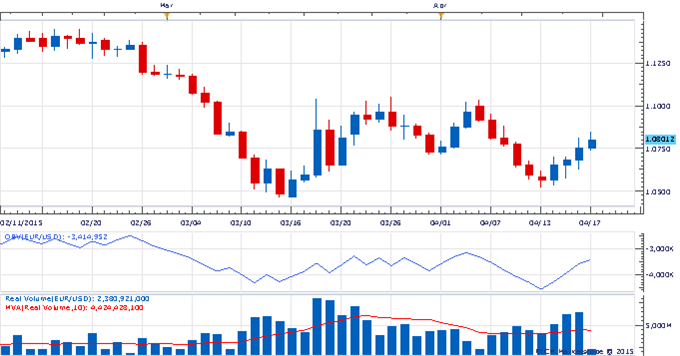
Daily Volume Chart: EUR/USD
The Weekly Volume Report: Dollar Trying To Turn?
Charts Created using Marketscope – Prepared by Kristian Kerr
  • EUR/USD has traded steadily higher over the past few days
  • Volume has been well above average during this rise and raises concerns that a more material correction higher is developing
  • The sharp rise in daily OBV is also a concern
  • A close over 1.1040 on above average volume is needed to turn the outlook more positive on the euro
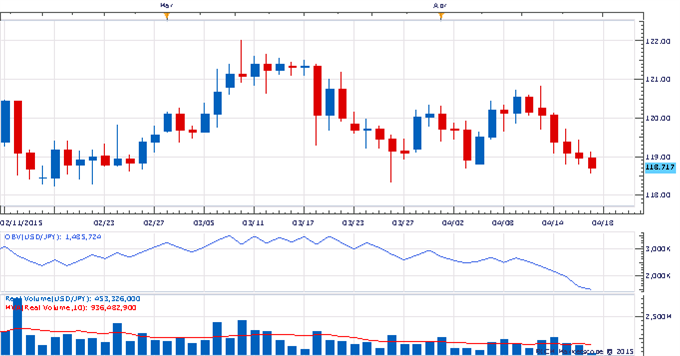
Daily Volume Chart: USD/JPY
The Weekly Volume Report: Dollar Trying To Turn?
Charts Created using Marketscope – Prepared by Kristian Kerr
  • USD/JPY has fallen steadily after failing near 121.00 earlier in the week
  • Below average volume during the decline is supportive
  • Persistent weakness in daily OBV does remains a cause for concern
  • A close under 118.00 on above average volume would turn us negative on the exchange rate
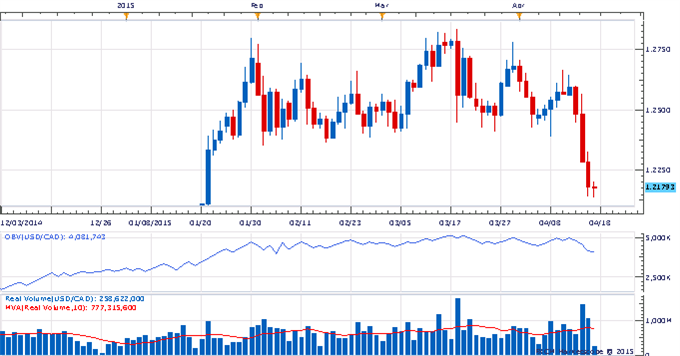
Daily Volume Chart: USD/CAD
The Weekly Volume Report: Dollar Trying To Turn?
Charts Created using Marketscope – Prepared by Kristian Kerr
  • USD/CAD fell sharply this past week to trade at its lowest level in almost three months
  • The move lower was accompanied by strong volume and warns a broader liquidation phase is underway
  • Daily OBV has also begun to pick up downside momentum
  • A daily close above 1.2450 on above average volume is needed to turn the outlook more positive for Funds

Price & Time: "Flaky Pattern" in USD/JPY

Talking Points
  • USD/JPY flirting with important downside pivot
  • GBP/USD stalls at Fib level
  • EUR/USD test key moving average
Get real time volume on your charts for free. Click HERE
Foreign Exchange Price & Time at a Glance:
Price & Time Analysis: EUR/USD
Price & Time: "Flaky Pattern" in USD/JPY
Charts Created using Marketscope – Prepared by Kristian Kerr
  • EUR/USD has recovered steadily after finding support last week near the 1.0585 78.6% retracement of the late March range
  • Our near-term trend bias is lower while below 1.0830
  • A breach of 1.0585 looks needed to set off a more important move to the downside in the euro
  • A very minor turn window is eyed tomorrow
  • A close over 1.0830 would turn us positive on the exchange rate
EUR/USD Strategy: Like the short side while under 1.0830.
Instrument
Support 2
Support 1
Spot
Resistance 1
Resistance 2
EUR/USD
*1.0585
1.0700
1.0750
1.0805
*1.0830
Price & Time Analysis: GBP/USD
Price & Time: "Flaky Pattern" in USD/JPY
Charts Created using Marketscope – Prepared by Kristian Kerr
  • GBP/USD stalled on Friday at the 1.5050 50% retracement of the late February/April decline
  • Our near-term trend bias is higher in Cable while above 1.4800
  • A close above 1.5050 is needed to trigger a more meaningful push higher in the pound
  • A very minor turn window is eyed tomorrow
  • A daily close under 1.4800 would turn us negative on the pound
GBP/USD Strategy: Looking to buy on weakness against 1.4800.
Instrument
Support 2
Support 1
Spot
Resistance 1
Resistance 2
GBP/USD
*1.4800
1.4885
1.4940
1.5000
*1.5050
Focus Chart of the Day: USD/JPY
Price & Time: "Flaky Pattern" in USD/JPY
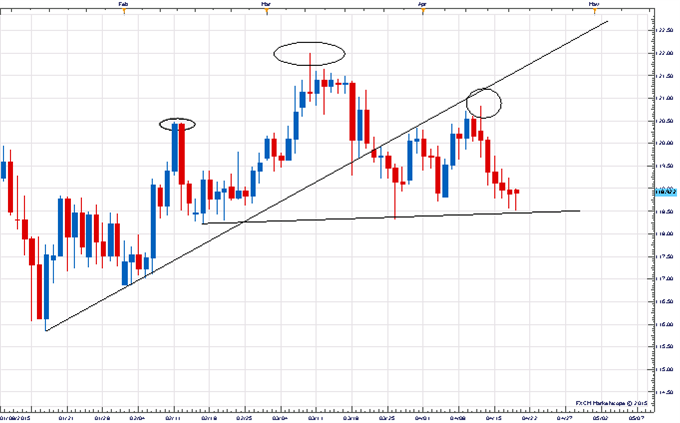
“Mainstream” analysts don’t seem to like chart patterns. This is a mistake in my view as chart patterns can give tremendous behavioral/psychological insight into an exchange rate. I am not the only who thinks this way apparently as even researchers at the Fed found them useful (albeit begrudgingly) in their rather infamous 1995 research piece “Head & Shoulders: Not Just A Flaky Pattern”. It can be read HERE. Personally I think where people run into trouble with pattern analysis is by trying to apply strict and rigid rules to them (which is ironically what the Fed researchers did). A pattern really is just showing a behavioral tendency after a set of technical occurrences. A “head & shoulders” pattern, for instance, is really just a development in a market where it has failed to record new highs. The “neckline” is just the point where a lot of short-term participants will bail out of long positions (or be forced to bail out if one acknowledges the self-fulfilling aspect of widely watched patterns). So why do I bring all this up today? USD/JPY - the price action since early February has set up a pretty clear potential head & shoulders pattern on the daily. Under 118.40 triggers.

$USDJPY Forecast and Trade setup for 30th March to 3rd April 2015

$USDJPY Forecast and Trade setup for 30th March to 3rd April 2015


Weekly Chart


  • Negative Divergence on RSI
  • Failed rally is what i can see because from the 61.8 fib

Daily Chart

  • Daily you could see a big drop in RSI momentum
  • Ichimoku is still on up trend, however could be easily broken as the cloud is weak
Hourly Chart

  • 4hr Ichimoku already have broken the up trend
  • Looks likely to test the 117.00 -116's

Outlook Trade opportunity

Personally I have a short trade from the ichimoku break and trendline break from the H4, and on top of that a weekly 61.8 fib

Risk Level __


Tips -

Always take note of any economical news event on our provided calender below

Monday, September 21, 2009

Signs a Stock is Set to Plummet

Nobody has said it in so many words, but we are at the closing stages of the recession. In a time when the market is going to rise and fall as it stabilizes, it is central to recognize when a stock is about to stagger. Everyone knows the essentials. Pass up investing in companies that create sub par earnings, has frail cash flow, or a less than ample balance sheet. On the other hand, there are other nasty characteristics a stock can retain that will drop it into the toilet in rainy economic weather. Keep an eye out for these other symptoms that illustrate an landslide ahead.

It is not uncommon for a company to reduce their earnings guidance. That can happen for a number of typical reasons that happen in the cycle a company goes through: slightly dropped earnings, a damaged economy, etc. Just make certain that the corporation in question clears the bar they set in that quarter. Why is that? Of course you are more concerned about the value of the stock than the revenue earned from them. Regrettably, some shareholders, particularly those with controlling interest are so worried about the revenue coming in and the performance of the company that value will go downward as people sell for poorer and lower prices to get out if they do not have faith in the supervision of the corporation.

It is also not unusual for insiders at a company to sell off some shares, particularly if life changes they are undertaking involve quick funds. Other times, you may be looking at an insider that just wants to make some speedy income or vary their holdings. Now and then if a bunch of executives all distribute of some of their shares at one time, you are looking at a disastrous future. You start to wonder, What do they know that I am not aware of? Be very wary of executives selling at or near their low points. That tells you the executives think their money is better somewhere else, and yours very well may be too.

One more signal that a stock may be in dilemma is when a company abruptly discontinues its guidance toward the investment industry. This may signal that the company has no idea or belief to have an idea of when earnings could come in. This may also have a slight signal in the way of product or service diversification. The company and its stockholders are in danger if the company cannot keep up with the accelerating market and/or does not come up with original, original products or services to keep up or stay at the forefront of the industry. You do not want to invest in a company that is gambling all their funds on one horse.

Keep an eye on industry trends as well. Sometimes the nature of the industry at that minute can impact that one company and its competitors at the same time. For example, General Motors, Chrysler and Ford all came down with the same sickness at the same time, due to the same amount overdue and the same mistakes. That was the time all GM, Chrysler and Ford stockholders bailed at once, and correctly so. Investors with a sharp eye that receive good, up-to-date news and suggestions from a website like this one may be able to limit or prevent losses just by watching these early signs.

Sunday, September 20, 2009

Investing in Forex

Investing in foreign currencies is a relatively new avenue of investing. There are considerably fewer people are aware of this market than there are people aware of several other avenues of investing. Trading foreign currency, also known as forex, is the most lucrative investment market that exists. There are several factors that make this true among which, successful forex traders earn realistic profits of one hundred plus percent each month. Compared to some of the better known investment markets such as corporate stocks, this is an unheard of return on investment. It's very necessary to mention here that a person who invests in forex must, without exception, make it a point to learn the detailed, but simple strategies and information surrounding the market. This very fact is what makes the difference between successful forex traders and other traders.

A few additional points, which create such powerful leverage for investors within the forex market are: The amount of capital required to begin investing in the market is only three hundred dollars. For the most part, any other investment market is going to demand thousands of dollars of the investor in the beginning. Also, the market offers opportunities to profit regardless what the direction of the market may be; In most commonly known markets investors sit and wait for the market to begin an up trend before entering a trade. Even then, investors, as a rule must sit and wait some more to be able to exit the trade with a nice profit. Given that the forex market produces several up, down, and sideways trends in a single day, it can easily be seen that forex stands head and shoulders above other markets. Additionally there are trading strategies, which are taught that provide for compounded profits; these are profits on top of profits. In addition, free demo accounts are available within the industry of forex trading, which facilitate the sharpening of skills without the risk losing any capital. And the advantage regarding the time factor in trading foreign currency is a very attractive point for any investor. Compared to one of the most sought after avenues of investing, which often requires forty or more hours each week, namely in the real-estate market, the forex market requires a much smaller demand on the investor's time. Forex trading requires approximately ten to fifteen hours each week to earn a full time income. It's easy to see that the advantages and great leverage that exist in the forex market, make it among the most lucrative, time liberating, and easy to enter by far.

I hope this information gives you a clear understanding of how you can turn your investing into a true method of making your money work harder for you.

by Joe Clinton

Reading a Forex Quote

Total newbies to the foreign exchange market can find reading a Forex quite intimidating (even baffling) at first. In fact, this is the most common initial hurdle. The quote is brief, but it packs in a great deal of useful information. And although it doesn't make a lick of sense to a newcomer, here's a quick, simple explanation of what it means.

A Forex quote is always based on a pair of currencies, where you're simultaneously selling one currency and buying another. And there are two prices, one for selling and the other for buying (bid price and ask price). When reading a Forex quote, it might typically look like this: USD/JPY 106.52/56

The first currency is called the base currency and the other is the quote currency. The base currency value is always 1 (in this case 1 US dollar). The number in the quote tells you how many of the quote currency (Japanese yen) you can buy with one US dollar.

And that number - 106.52/56 - is a shortened version of two numbers (106.52 and 106.56). The lower number is the bid price; the other is the ask price. The bid price shows how much a dealer will buy the base currency for. The ask price shows how much a dealer is willing to sell it for.

If you saw 106.52/56 when reading a Forex quote, it would mean that you could sell US dollars and receive 106.52 yen per dollar. On the other hand, if you wanted to buy US dollars, you would have to pay 106.56 yen for each dollar.

The difference between the bid price and the ask price in a Forex quote is called the "spread," and each tiny 0.01 unit is called a "pip." In our example, the spread for our USD/JPY quote is four pips. The spread for the most commonly traded currencies is usually that small. In general, you'll do most of your trading in US dollars, Japanese yen, Great Britain pounds, Euros, Swiss francs or Australian dollars. Also please keep in mind that when the competition really heats up some spreads will be as small as one pip.

On the other hand, for less heavily traded currencies, you may run into much larger spreads. But don't think that a small spread means tiny profits (or losses). When you're trading hundreds of thousands of units, even that one pip spread can mean big money.

Let's say you're dealing with just 100 US dollars. Selling your hundred dollars for 10,652 yen and buying them for 10,656 yen only amounts to a four yen difference. But most Forex traders will be dealing with amounts of 100,000 US dollars (or many multiples). So now we know, when reading a Forex quote, that even such an unimpressive little four-pip spread amounts to considerably more (at 4,000 yen, and probably several multiples of that).

And of course, similar trades may be repeated throughout the day and the week. This means that anytime you're reading a Forex quote, you'll recognize that this tiny little spread is more important than its meager size at first suggests.

Advantages of the Forex Market

What are the advantages of the Forex Market over other types of investments?

When thinking about various investments, there is one investment vehicle that comes to mind. The Forex or Foreign Currency Market has many advantages over other types of investments. The Forex market is open 24 hrs a day, unlike the regular stock markets. Most investments require a substantial amount of capital before you can take advantage of an investment opportunity. To trade Forex, you only need a small amount of capital. Anyone can enter the market with as little as $300 USD to trade a "mini account", which allows you to trade lots of 10,000 units. One lot of 10,000 units of currency is equal to 1 contract. Each "pip" or move up or down in the currency pair is worth a $1 gain or loss, depending on which side of the market you are on. A standard account gives you control over 100,000 units of currency and a pip is worth $10.

The Forex market is also very liquid. When trading Forex you have full control of your capital.

Many other types of investments require holding your money up for long periods of time. This is a disadvantage because if you need to use the capital it can be difficult to access to it without taking a huge loss. Also, with a small amount of money, you can control

Forex traders can be profitable in bullish or bearish market conditions. Stock market traders need stock prices to rise in order to take a profit. Forex traders can make a profit during up trends and downtrends. Forex Trading can be risky, but with having the ability to have a good system to follow, good money management skills, and possessing self discipline, Forex trading can be a relatively low risk investment.

The Forex market can be traded anytime, anywhere. As long as you have access to a computer, you have the ability to trade the Forex market. An important thing to remember is before jumping into trading currencies, is it wise to practice with "paper money", or "fake money." Most brokers have demo accounts where you can download their trading station and practice real time with fake money. While this is no guarantee of your performance with real money, practicing can give you a huge advantage to become better prepared when you trade with your real, hard earned money. There are also many Forex courses on the internet, just be careful when choosing which ones to purchase.

by Heather Redmond

Friday, September 18, 2009

Forex Enterprise — A Full Review

A new marketing course to hit the internet by Nick Marks that advertises earnings of $1000 a day and $30,000 a month respectively. This turnkey system generating multiple streams of income is relatively new and so it is my pleasure to review it for you.

After purchasing you are given a login page where you are introduced to the system which is in website format. Everything is easy to access and well organized.

After Nick gives you a little pep talk about positive thinking and goal setting, you will be introduced to his first recommendation: join Coastal Vacations. While not a part of his main Forex system this is a recommendation I could've done without.

In the pay per click section you are given a large list of keywords that Nick found convert really well with his system. Some of the keywords in the list have bid prices already attached to them so you can get front page exposure.

The course also has $50 in free adwords credit that unfortunately only works with new accounts so I was out of luck. If you don't already have an account this is worth the price of the course alone.

The forex course shows you some inexpensive traffic methods and provides links to these sources. He also covers stuff like pop-over ads, e-mail lists and autoresponders. Not bad information by any means, and is an alternative to pay per click advertising if you have a smaller budget.

He has an ebook package that seemed like it was going to be really cool as there were dozens of bonus ebooks and software programs covering everything from creating ebooks and website templates, to getting top positions in the major search engines.

As I took a closer look at this package I realized there were some bargain bin informational products included. However, there were also alot of goodies in there as well that I found rather useful. You get so many ebooks and software in here that it really is worth far more than the price of the course.

There is a section on becoming an Ebay power seller in 90 days that goes into a fair amount of detail and wasn't bad. However, Ebay isn't something I have ever been particularly interested in doing. There is also a section on baccarat strategies that I had no interest in.

One of the last sections of his course introduces you to e-currency exchanging using the DXINONE system. It is a great way to acquaint yourself with this increasingly popular opportunity without having to buy standalone e-currency courses which can cost a couple hundred dollars.

The author has combined several effective ways to earn money online and rolled them all into one course. While I didn't jump up and down about all of his strategies, the free ebooks, software, and adwords credit make Forex Enterprise worth the money.

by Joey Merrick

Saturday, September 12, 2009

Investing in Forex

Investing in foreign currencies is a relatively new avenue of investing. There are considerably fewer people are aware of this market than there are people aware of several other avenues of investing. Trading foreign currency, also known as forex, is the most lucrative investment market that exists. There are several factors that make this true among which, successful forex traders earn realistic profits of one hundred plus percent each month. Compared to some of the better known investment markets such as corporate stocks, this is an unheard of return on investment. It's very necessary to mention here that a person who invests in forex must, without exception, make it a point to learn the detailed, but simple strategies and information surrounding the market. This very fact is what makes the difference between successful forex traders and other traders.

A few additional points, which create such powerful leverage for investors within the forex market are: The amount of capital required to begin investing in the market is only three hundred dollars. For the most part, any other investment market is going to demand thousands of dollars of the investor in the beginning. Also, the market offers opportunities to profit regardless what the direction of the market may be; In most commonly known markets investors sit and wait for the market to begin an up trend before entering a trade. Even then, investors, as a rule must sit and wait some more to be able to exit the trade with a nice profit. Given that the forex market produces several up, down, and sideways trends in a single day, it can easily be seen that forex stands head and shoulders above other markets. Additionally there are trading strategies, which are taught that provide for compounded profits; these are profits on top of profits. In addition, free demo accounts are available within the industry of forex trading, which facilitate the sharpening of skills without the risk losing any capital. And the advantage regarding the time factor in trading foreign currency is a very attractive point for any investor. Compared to one of the most sought after avenues of investing, which often requires forty or more hours each week, namely in the real-estate market, the forex market requires a much smaller demand on the investor's time. Forex trading requires approximately ten to fifteen hours each week to earn a full time income. It's easy to see that the advantages and great leverage that exist in the forex market, make it among the most lucrative, time liberating, and easy to enter by far.

I hope this information gives you a clear understanding of how you can turn your investing into a true method of making your money work harder for you.

by Joe Clinton

Advantages of the Forex Market

What are the advantages of the Forex Market over other types of investments?

When thinking about various investments, there is one investment vehicle that comes to mind. The Forex or Foreign Currency Market has many advantages over other types of investments. The Forex market is open 24 hrs a day, unlike the regular stock markets. Most investments require a substantial amount of capital before you can take advantage of an investment opportunity. To trade Forex, you only need a small amount of capital. Anyone can enter the market with as little as $300 USD to trade a "mini account", which allows you to trade lots of 10,000 units. One lot of 10,000 units of currency is equal to 1 contract. Each "pip" or move up or down in the currency pair is worth a $1 gain or loss, depending on which side of the market you are on. A standard account gives you control over 100,000 units of currency and a pip is worth $10.

The Forex market is also very liquid. When trading Forex you have full control of your capital.

Many other types of investments require holding your money up for long periods of time. This is a disadvantage because if you need to use the capital it can be difficult to access to it without taking a huge loss. Also, with a small amount of money, you can control

Forex traders can be profitable in bullish or bearish market conditions. Stock market traders need stock prices to rise in order to take a profit. Forex traders can make a profit during up trends and downtrends. Forex Trading can be risky, but with having the ability to have a good system to follow, good money management skills, and possessing self discipline, Forex trading can be a relatively low risk investment.

The Forex market can be traded anytime, anywhere. As long as you have access to a computer, you have the ability to trade the Forex market. An important thing to remember is before jumping into trading currencies, is it wise to practice with "paper money", or "fake money." Most brokers have demo accounts where you can download their trading station and practice real time with fake money. While this is no guarantee of your performance with real money, practicing can give you a huge advantage to become better prepared when you trade with your real, hard earned money. There are also many Forex courses on the internet, just be careful when choosing which ones to purchase.

by Heather Redmond

Wednesday, September 9, 2009

Forex Trading Strategies And Systems

I've been trading the forex markets for several years now so I've developed quite a few different systems in my time. However there are some that are more profitable than others, so let me share you with you some of my most profitable forex trading strategies.

4 Hour Trading Strategy

I created this trading strategy myself and have been using it for several years now. This one system has generated more profits that any other system I have ever used, and yet it's surprisingly simple.

I simply look at the daily trend for a particular currency pair (usually the GBP/USD, EUR/USD or USD/JPY pair) using a very simple but effective technical indicator, then I wait for two EMAs (exponential moving averages) to cross over in the same direction on the 4 hour chart.

I will then enter a position (usually after a slight pull-back) and will employ a two-part exit strategy to maximise my profits. One half of the position will be closed out early for a safe profit, and the other half will be left to run for as long as possible in order to capture those really big price moves.

As I say, this particular forex trading strategy is highly effective, as regular readers of my blog will know because I share my trading results every week in my 'Weekly Trading Updates'.

Anyway if you would like to read all about my 4 hour trading method, you can access it (for free) by filling in the short form to the right and subscribing to my newsletter.

The only problem with trading this strategy is that there will always be quiet periods and particular days where you know you are not going to get any set-ups on any of the major currency pairs. Therefore at times like these I will often employ some of the other trading methods that I keep in reserve:

CCI Divergence Trading System

This is a forex system that I've recently created and it basically uses the popular CCI indicator with two different settings. The key here is to wait until there is divergence between both of the CCI indicators at the same time because this will give you a set-up with a very high success rate.

You don't get that many good set-ups per day using this trading strategy, but when you do, you are likely to make some decent profits because it is a very high probability set-up.

I have discussed this particular strategy elsewhere on this blog so please click here if you want to find out more about this CCI Divergence Trading System.

Forex Income Engine 2.0 Methods

At the time of writing (20 June 2009) I've just started using the three day trading methods included in the Forex Income Engine 2.0 course as well. I've always been quite sceptical about many of the short-term forex methods that I come across, but I've been very impressed with these three methods so far because they do actually produce some very good returns.

Anyway if you would like more details about each of these methods you can read all about them on my Forex Income Engine 2.0 review page.

Forex Nitty Gritty Method

This trading method was included in the Forex Nitty Gritty course and although it is a very basic method, it is actually surprisingly effective. The goal is to look for pairs that are in strong upward or downward trends, wait for a pull-back, and then enter a trade if the trend continues.

I've been using this method on the 15 minute charts for quite a while now and it has always performed well for me because these continuation trends occur all the time.

Again if you would like to find out more about this particular trading method, you may like to read my full review of Forex Nitty Gritty.

Long-Term Trading Strategy

I'm not really a long-term trader but I do occasionally open a position if a good trading opportunity arises. I will usually use the daily charts for these trades and will look at a variety of indicators such as the 200 day moving average, the supertrend indicator, established support and resistance levels, fibonacci levels if applicable, and Marketclub's excellent trading signals.

I will regularly post my long-term analysis of the various currency pairs on this blog, but I will only follow this up with an actual trade if I'm really confident about my predictions.

Other Forex Trading Strategies

Finally as well as all of the trading systems and strategies listed on this page, I also have a few breakout strategies that I like to use when a good opportunity presents itself. I'm also constantly testing out new ideas and reviewing the various trading systems that I get sent regularly by product owners who want me to promote their product.

However for the most part it's my 4 hour trading strategy that I spend most time on because this is my core system which generates the most consistent and reliable profits. All of the other forex trading systems are used to boost my trading pot during the quieter periods of the week.

Tuesday, September 8, 2009

FOREX 101: Make Money with Currency Trading

For those unfamiliar with the term, Forex (FOReign EXchange market), refers to an international exchange market where currencies are bought and sold. The Foreign Exchange Market that we see today began in the 1970's, when free exchange rates and floating currencies were introduced. In such an environment only participants in the market determine the price of one currency against another, based upon supply and demand for that currency.

Forex is a somewhat unique market for a number of reasons. Firstly, it is one of the few markets in which it can be said with very few qualifications that it is free of external controls and that it cannot be manipulated. It is also the largest liquid financial market, with trade reaching between 1 and 1.5 trillion US dollars a day. With this much money moving this fast, it is clear why a single investor would find it near impossible to significantly affect the price of a major currency. Furthermore, the liquidity of the market means that unlike some rarely traded stock, traders are able to open and close positions within a few seconds as there are always willing buyers and sellers.

Another somewhat unique characteristic of the Forex money market is the variance of its participants. Investors find a number of reasons for entering the market, some as longer term hedge investors, while others utilize massive credit lines to seek large short term gains. Interestingly, unlike blue-chip stocks, which are usually most attractive only to the long term investor, the combination of rather constant but small daily fluctuations in currency prices, create an environment which attracts investors with a broad range of strategies.

How Forex Works

Transactions in foreign currencies are not centralized on an exchange, unlike say the NYSE, and thus take place all over the world via telecommunications. Trade is open 24 hours a day from Sunday afternoon until Friday afternoon (00:00 GMT on Monday to 10:00 pm GMT on Friday). In almost every time zone around the world, there are dealers who will quote all major currencies. After deciding what currency the investor would like to purchase, he or she does so via one of these dealers (some of which can be found online). It is quite common practice for investors to speculate on currency prices by getting a credit line (which are available to those with capital as small as $500), and vastly increase their potential gains and losses. This is called marginal trading.

Marginal Trading

Marginal trading is simply the term used for trading with borrowed capital. It is appealing because of the fact that in Forex investments can be made without a real money supply. This allows investors to invest much more money with fewer money transfer costs, and open bigger positions with a much smaller amount of actual capital. Thus, one can conduct relatively large transactions, very quickly and cheaply, with a small amount of initial capital. Marginal trading in an exchange market is quantified in lots. The term "lot" refers to approximately $100,000, an amount which can be obtained by putting up as little as 0.5% or $500.

EXAMPLE: You believe that signals in the market are indicating that the British Pound will go up against the US Dollar. You open 1 lot for buying the Pound with a 1% margin at the price of 1.49889 and wait for the exchange rate to climb. At some point in the future, your predictions come true and you decide to sell. You close the position at 1.5050 and earn 61 pips or about $405. Thus, on an initial capital investment of $1,000, you have made over 40% in profits. (Just as an example of how exchange rates change in the course of a day, an average daily change of the Euro (in Dollars) is about 70 to 100 pips.)

When you decide to close a position, the deposit sum that you originally made is returned to you and a calculation of your profits or losses is done. This profit or loss is then credited to your account.

Investment Strategies: Technical Analysis and Fundamental Analysis

The two fundamental strategies in investing in Forex are Technical Analysis or Fundamental Analysis. Most small and medium sized investors in financial markets use Technical Analysis. This technique stems from the assumption that all information about the market and a particular currency's future fluctuations is found in the price chain. That is to say, that all factors which have an effect on the price have already been considered by the market and are thus reflected in the price. Essentially then, what this type of investor does is base his/her investments upon three fundamental suppositions. These are: that the movement of the market considers all factors, that the movement of prices is purposeful and directly tied to these events, and that history repeats itself. Someone utilizing technical analysis looks at the highest and lowest prices of a currency, the prices of opening and closing, and the volume of transactions. This investor does not try to outsmart the market, or even predict major long term trends, but simply looks at what has happened to that currency in the recent past, and predicts that the small fluctuations will generally continue just as they have before.

A Fundamental Analysis is one which analyzes the current situations in the country of the currency, including such things as its economy, its political situation, and other related rumors. By the numbers, a country's economy depends on a number of quantifiable measurements such as its Central Bank's interest rate, the national unemployment level, tax policy and the rate of inflation. An investor can also anticipate that less quantifiable occurrences, such as political unrest or transition will also have an effect on the market. Before basing all predictions on the factors alone, however, it is important to remember that investors must also keep in mind the expectations and anticipations of market participants. For just as in any stock market, the value of a currency is also based in large part on perceptions of and anticipations about that currency, not solely on its reality.

Make Money with Currency Trading on Forex

Forex investing is one of the most potentially rewarding types of investments available. While certainly the risk is great, the ability to conduct marginal trading on Forex means that potential profits are enormous relative to initial capital investments. Another benefit of Forex is that its size prevents almost all attempts by others to influence the market for their own gain. So that when investing in foreign currency markets one can feel quite confident that the investment he or she is making has the same opportunity for profit as other investors throughout the world. While investing in Forex short term requires a certain degree of diligence, investors who utilize a technical analysis can feel relatively confident that their own ability to read the daily fluctuations of the currency market are sufficiently adequate to give them the knowledge necessary to make informed investments.

by Rich McIver

Goodman’s Swing Count System - by M. Duane Archer

Part One (of Three) - Introduction and Overview

"You Can Figure the Markets, but You Can’t Figure the Human Race"

-Charles B. Goodman

Historical Perspective

The Principles of Goodman’s Swing Count System were informally set forth in a series of annotated commodity charts from the late 1940’s to the early 1970’s. These trading studies simply titled ‘My System’ were the work of Charles B. Goodman and were never published.

I met Charles Goodman at the Denver, Colorado offices of Peavey and Company (later, Gelderman) in the fall of 1971. It was the occasion of my maiden voyage in the great sea of commodity trading (later, futures). In 1971 silver prices were finally forging ahead to the $2.00/ounce level. A 10-cent limit move in soybeans elicited a full afternoon of post-mortems by traders and brokers alike.

The Peavey office, managed by the late and great Pete Rednor employed eight brokers (later, account representatives). The broker for both Mr. Goodman and I was the colorful - and patient - Ken Malo. Brokers, resident professional traders - including Mr. Goodman and the Feldman brothers, Stu and Reef - and a regular contingent of retail customers drew inspiration from a Trans-Lux ticker that wormed its way across a long, narrow library table in the back of the office. Most impressive was a large clacker board quote system covering almost the entire front office wall. This electro-mechanical quotation behemoth made loud clacking sounds (thus its name) each time an individual price flipped over to reveal an updated quote. Green and red lights flashed, denoting daily new highs and lows. Pete, apart from being an excellent office manager was also a fine showman using the various stimuli to encourage trading activity!

Almost everyone made frequent reference to Charlie’s huge bar charts posted on 2 ½ by 4-foot sheets of graph paper, mounted on heavy particle board and displayed on large easels. No one ever really knew what the numerous right-hand brackets ( ]) of varying lengths scattered throughout each chart meant. But there was always a great deal of speculation! The present work finally reveals the meaning of those mysterious trading hieroglyphics.

The quiet chatter of the tickertape, the load clacking of the quote board, the constant ringing of the telephones. The news ticker that buzzed once for standing reports, twice for opinions and three times for ‘hot news’, the squawk boxes and Pete Rednor’s authoritative voice booming, ‘Merc!, Merc!". What a spectacular scene it was! No wonder that this author, then a 21-year old trading Newbie would soon make commodity futures and currency trading his life’s work.

But nothing made a greater impression on me than the work of Charles B. Goodman. He instilled first, some very simple ideas: "Avoid volatile markets when at all possible" - "Trade only high percentage short term ‘ducks’ " - "Sit on your hands, Dad, sit on your hands". It didn’t take long for me to adopt the ultra-conservative ‘Belgian Dentist’ style of trading, that is - "Avoiding losing trades is more important than finding winning trades"

The Belgian Dentist approach carried with me when I developed my famous AI trading system in the 1980’s - Jonathan’s Wave. Even though it generated 48% annual returns with a zero expectation of a 50% drawdown (according to Managed Account Reports) it drove the brokers berserk because it could easily go a full month without making a single trade!

Charlie’s trading advice, I am certain, allowed me to survive the financial Baptism of Fire that destroys most commodity and currency trading Newbies in a matter of months, if not weeks.

Mr. Goodman was to be my one and only trading mentor. Over the decade that followed he entrusted to me many, if not most of his trading secrets. To the best of my knowledge he shared this information on his work with no one else in such detail.

Charlie and I spent hundreds of hours together analyzing the trade studies from My System. We also analyzed hundreds of other commodity, currency and securities charts. Charlie was happy with My System being ‘organized’ in his mind. But as a new generation technical analyst, I was anxious to see it formalized on paper and eventually in source code on a computer. (To be honest this created a small amount of friction between the two of us - Charlie was dead set against formalized systems and believed strongly in the psychological and money management elements of trading.) Notwithstanding, by 1979 I was finally ready and able to formally state the principles of My System. Because of its equal concern for price measurements (parameters) and price levels interacting together (matrices) I originally renamed My System ‘ParaMatrix’. My first investment management company in the mid-1970’s was ParaMatrix Investment Management and I acted as both a registered Investment Advisor (SEC) and Commodity Trading Advisor (CFTC).

Contrary to ongoing speculation, only two copies of my original 1979 ‘Principles of ParaMatrix’ ever existed. I possess both of them. Charlie’s original My System trade studies were mistakenly destroyed shortly after his death in 1984. What remains of them are the 200 or so examples I copied into Principles of ParaMatrix.

The present work, Goodman’s Swing Count System (GSCS), is a reorganized re-issue of Principles of ParaMatrix with updated charts and a simplified nomenclature that I am sure Charlie would have appreciated; "Keep it simple, Dad!" he would always advise. I’ve also expanded on Charlie’s ideas by ‘filling in’ some less formed ideas such as his market notation, or calculus as he referred to it, and a method for charting which I have dubbed Goodman Charting.

Two of Charlie’s less well-defined ideas are NOT included in this work: 1) Dependent/Scaled Interfacing and 2) Time-Based (cyclical) measurements. There are also a number of intra-swing formations I have not discussed.

My own direction in futures and currencies turned in the 1980’s to artificial intelligence (Jonathan’s Wave) and in the 1990’s and today, artificial life and cellular automata (The Trend Machine). In spite of, or perhaps because of these complicated ‘cutting edge’ computer efforts I continue to view Goodman’s Swing Count System (GSCS) in a very positive light. To this day, the first thing I do when I see any chart is a quick Goodman analysis!

GSCS is a natural ‘system’ for pursuing the conservative Belgian Dentist approach to trading, even without the aid of a computer. This article, in fact, could be used to make Goodman analysis without a computer at all! But it is in fact intended as an introduction to the CommTools Analytic Suite GSCS software. That software is intended as a supplemental tool only for doing Goodman chart analysis.

GSCS trade opportunities are as frequent today (perhaps more frequent) than they were 40 or 50 years ago. I believe the system’s foundations have well stood the test of time. Patterns today are no different than they were decades ago - nor are the twin human emotions - Fear and Greed - that create them. GSCS is an excellent method for finding support and resistance areas that no other method spots, and for locating potential turning points in any market. One of its best suits - it can easily integrate into other trading techniques and methodologies.

I would never recommend or advise anyone to use a 100% mechanical trading system, GSCS or any other!

Is it really a ‘system’? Depending upon your perspective GSCS is between 70% and 90% mechanical. The program available from CommTools, Inc (www.commtools.com) represents the kernel idea of mechanizing perhaps 80% of the system. I now believe attempting to completely code Charlie’s work would be inadvisable.

Mr. Goodman passed away in 1984. It was always his desire to share with others - although as is usually the case with true genius - few wanted to listen. These days we are ever more bombarded ever more cryptic and computer-dependent software programs and ‘black-boxes’. Perhaps now is the time for the simple yet theoretically well-grounded ideas of GSCS to populate.

The publication of this brief work and the GSCS software, I hope and pray, would meet with Charlie’s wishes. His work in extracting an objective and almost geometrically precise (ala Spinoza) trading system out of a simple trading rule (the ‘50% rule’) is most remarkable. It has certainly earned him the right to be included in the elite group of early scientific traders including Taylor, Elliot, Gann and Pugh.

Conforming to the spirit of the original My System, I’ve attempted to keep theoretical discussions and formulations to a necessary minimum. Trade studies in Part 3 of this article must still be considered the crux of GSCS, even though I am pleased with the formalization of most relevant principles in Part 2. The trader weary of theoretical discussions and intrigue will find all the concepts and principles delineated in the trade study examples. Nevertheless, those who invest time in the theory of GSCS will undoubtedly discover an area for further exploration where many new and fresh ideas are waiting to be mined.

In Mr. Goodman’s worldly absence, the responsibility for this work and its contents is solely mine, for better or for worse.

Theoretical Overview and Definitions

The cornerstone of GSCS is the age-old ‘50 Percent Retracement and Measured Move’ rule. This rule, familiar to most traders goes back almost as far as the organized markets themselves. It has been traced to the times when insiders manipulated railroad stocks in the 19th Century.

DIAGRAM 1-1: The 50 Percent Retracement and Measured Move Rule

The first systematic description of THE RULE was given in Burton Pugh’s The Great Wheat Secret. This book was originally published in 1933. In 1973, Charles L. Lindsay published Trident. This book did much - some say too much! - to quantify and mathematically describe THE RULE. Nevertheless, must reading for anyone interested in this area of market methodology. Edward L. Dobson wrote The Trading Rule That Can Make You Rich in 1978. This is a good work with some nice examples. But none of these, in my humble opinion, even scratch the surface, relative to Goodman’s work.

In 1975 a well-know Chicago grain floor trader, Eugene Nofri, published The Congestion Phase System. This small but power-packed volume detailed a short term trading method using simple but effective ‘congestion phases’. While not precisely a work on THE RULE it touched - from a different perspective - some of Charlie’s ideas.

Diagram 1-2: A Congestion Phase

[I mention Nofri’s work also because Charlie was especially taken by its simplicity and because it can work well in conjunction with GCSC. The idea of melding GCSC with a congestion phase approach ought to produce a method of finding those high percentage ‘ducks’ that the Belgian Dentist so much loves! Charlie also felt that Hadady’s work on Contrary Opinion was a natural ‘fit’ especially since the GCSC support and resistance points seldom lie where anyone else thinks they should.]

Still, in the end, it was left for Charles B. Goodman, the great grain trader from Eads, Colorado to extract all the logical consequences from THE RULE and transform it into a robust, almost geometrically precise system.

The logic of THE RULE is quite simple. At a 50% retracement, both buyers and sellers of the previous trend (Up or Down) are ceteris paribus ‘in balance’. Half of each holds profits and half of each holds losses.

Diagram 1-3: A Market Tug of War

The equilibrium is a tenuous one, indeed. The distribution of buyers and sellers over the initial price trend or swing is obviously not perfectly even: Some buyers hold more contracts than other buyers. They have also different propensities for taking profits or losses. Nor does it account for the buyers and sellers who have entered the market before the initial swing or during the reaction swing. Not all of the buyers and sellers from the original swing may be in the market any longer.

Remarkably, GCSC eventually takes all of this into account - especially they buyers and sellers at other price swing levels, called matrices.

Nevertheless, the 50% retracement point IS often a powerful and very real point of equilibrium and certainly a ‘known and defined hot spot’ of which one should be aware. Remember both the futures markets and the currency markets are very close to a zero-sum game’. It is only commissions, pips and slippage that keep them from being zero-sum. At the 50% point it doesn’t take much to shift the balance of power for that particular swing matrix.

THE RULE also states the final (3rd) swing of the move - back in the direction of the initial swing - will equal the value of the initial swing. The logic of this idea, called the ‘measured move’ is seen in the following diagram. At the ‘D’ point one side (in this case the buyers) have won and the sellers are ‘wiped out.’

Diagram 1-4: The Measured Move and ‘Unwinding’

As we have alluded to examples of THE RULE occur at ALL price levels or matrices and many are being ‘worked’ simultaneously in any given ongoing market. This is a critical point. In modern terminology it would be said that price movements are ‘recursive’. Simply stated this means that without labeling you could not really tell the difference between a 10-minute chart and a daily or weekly chart - they all exhibit the same behavior and operate under the same principles of Parameter and Matrix.

The bar graphs below were taken from actual market data. It is functionally impossible to tell apart the time units, with respect to the chart action.

Diagram 1-5: The Markets are Recursive

Now we can begin to informally define SIX of the SEVEN CONCEPTS in THE RULE that Mr. Goodman used to construct GCSC. What had been neglected by previous theorists, users, writers and purveyors of THE RULE was this:

The 50% point is indeed an equilibrium point. As such, the equilibrium must ‘give way’ BUT EITHER SIDE (buyers or sellers) in either a downtrend or an uptrend may prevail at any given matrix or price level.

Goodman realized both the possibilities for a REVERSAL (as in the case of the completed measured move) and a PRICE SURGE. A price surge would be the equivalent to the sellers (in an uptrend) and the buyers (in a downtrend) winning the tug of war within a matrix. In price action this means prices would fall or rise to at least the beginning point of the initial swing!

Diagram 1-6: Price Surge - The FIRST Concept

In other words - the measured move is not a done deal - the 50% retracement (Diagram 1-1a) could also become a ‘V’ or inverted ‘V’ as in the next diagram. The 50% retracement is not a reversal point (necessarily) but should be considered as a ‘point of interest’ where prices may be more likely than randomly to decide whether to continue or reverse.

It may not sound like much, but it is a major discovery.

Clearly price surges are implicit in THE RULE. But they are not visible on a chart unless you are looking for them and unless you are considering the 50% retracement as a ‘point of interest’ and not necessarily a reversal. In fact, most practitioners perceive a price surge as a failure of THE RULE!

Even more importantly, Goodman discovered the implications of THE RULE occurring simultaneously at all price levels. I remember EXACTLY the day and place when Charlie showed me this one - it hit me as truly a grand revelation on the markets!

Diagram 1-7: THE RULE at Multiple Levels (Matrices) of Operation - The SECOND Concept

Here you are: The initial (primary) trend and secondary (reaction trend) as well as reversals (measured moves) and surges are relative to price matrix context. What is one thing in one price matrix may well be its opposite in a higher (or lower) matrix.

(It’s true - Elliot Wave Theory contains the same concept. But with GCSC you can tell BEFORE (in many instances) which it is. In Elliot you can only tell AFTER. GCSC is a predictive system, while Elliot - grand and elegant as it is - is primarily a descriptive system.)

All Price Matrices (levels) - in theory - are part of a larger price matrix,

All Price Matrices composed of smaller price matrices

Of course there is the practical limitation of the smallest possible fluctuation.

Besides Reversals and Surges GCSC matrix concepts include Domination and Generation.

Clearly prices do not always seem to find any kind of equilibrium at the 50% retracement price area. Or, so it may seem. This leads to the third Grand discovery:

The extent a price swing overshoots or undershoots its ideal 50% retracement that price value will be ‘made up’ on the next price swing within the matrix.

Now THIS is the trading rule that can make you rich!

For example, if prices fall only 40% of the initial trend and reverse, the measured move will actually be either 90% or 110% of the measured move point and value of the primary (initial swing in the matrix. The 10% difference - GCSC holds - MUST be made up eventually. This is the concept of Compensation.

Diagram 1-8: Examples of Compensation within a Matrix - The THIRD Concept

Furthermore: If the difference is not fully made up in the final price swing of a matrix the cumulative ‘miss’ value will carry over through each price subsequent price matrix until it does. This is the concept of Carry Over. A ‘carryover’ table is used to add and subtract cumulative carry over values until they cancel.

Diagram 1-9 Carry Over - The FOURTH Concept

When no Carry Over remains, the price matrix is said to have ‘cleared’ or ‘cancelled’. This is the GCSC concept of Cancellation. Cancellation is critical to finding GCSC support and resistance points and other chart ‘hot spots’ where something much less than random is likely to occur.

Diagram 1-10: Cancellation - The FIFTH Concept

The exact method for these important concepts is more fully described in this article, Part 2.

We can now get an early glimpse of what the strange brackets on Charlie’s charts were all about.

Diagram 1-11: Meaning of the Brackets Revealed

Charlie had even more ideas:

The importance of a ‘hot spot’ in relationship to its likelihood of being an important point of support or resistance, reversal or continuation, increased when two or more price matrices cancel at the same price or same price area. This is the key concept of Intersection. There is no analogous concept in Elliot, the most common ‘competitor’ to GSCS. Intersection makes GSCS much more objective and testable than other swing systems.

Diagram 1-12: Intersections - The SIXTH Concept

This article has covered micro formations. Charlie also had compiled a dozen or so extremely valuable macro formations - combinations of micros.

I encourage the reader to examine some charts and find simple areas of the intersection of two (or three) matrices. You will see at once that these points are GOLDEN to the trader. If I had, after 30 years of studying the markets one idea to impart it would be to show you an example of a GSCS intersection in 2 or 3 matrices.

Remember, Carry Over is to the same or NEXT larger price matrix. The above are examples of Independent Intersections. That is, each price level Carry Over calculation is kept separate from the others and ‘tallied’ at the end of each matrix. Charlie had also developed (much less precisely) a concept of Dependent Intersections but it is quite complex, beyond the scope of this article and worth of further codification into software at a future date.

If you would like more information on Parts II and III, comprising a complete tutorial on GSCS, or if you have questions, I would be happy to hear from you.

M.Duane Archer

14 February 2004

Further Reading:
Goodman Chart Study #1
Goodman Chart Study #2

About the Author: Mike Archer is the author of the popular Currency Trader's Companion series, and co-author of a new book entitled "Getting Started in Currency Trading" available in the bookstore now. His new site may be found at http://www.fxpraxis.com