Talking Points
- USD/JPY flirting with important downside pivot
- GBP/USD stalls at Fib level
- EUR/USD test key moving average
Get real time volume on your charts for free. Click HERE
Foreign Exchange Price & Time at a Glance:
Price & Time Analysis: EUR/USD

- EUR/USD has recovered steadily after finding support last week near the 1.0585 78.6% retracement of the late March range
- Our near-term trend bias is lower while below 1.0830
- A breach of 1.0585 looks needed to set off a more important move to the downside in the euro
- A very minor turn window is eyed tomorrow
- A close over 1.0830 would turn us positive on the exchange rate
EUR/USD Strategy: Like the short side while under 1.0830.
Instrument
|
Support 2
|
Support 1
|
Spot
|
Resistance 1
|
Resistance 2
|
EUR/USD
|
*1.0585
|
1.0700
|
1.0750
|
1.0805
|
*1.0830
|
Price & Time Analysis: GBP/USD
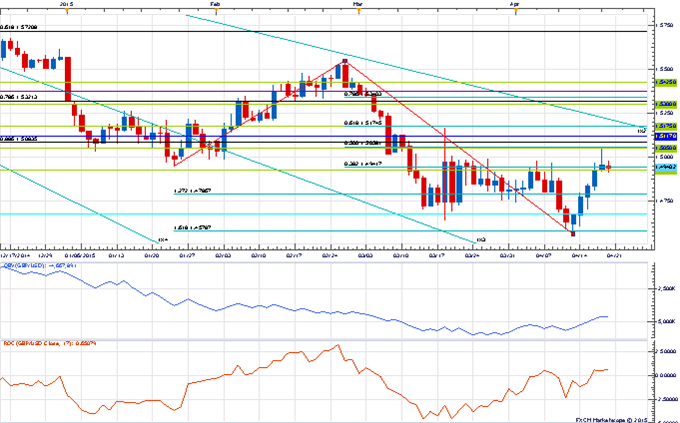
- GBP/USD stalled on Friday at the 1.5050 50% retracement of the late February/April decline
- Our near-term trend bias is higher in Cable while above 1.4800
- A close above 1.5050 is needed to trigger a more meaningful push higher in the pound
- A very minor turn window is eyed tomorrow
- A daily close under 1.4800 would turn us negative on the pound
GBP/USD Strategy: Looking to buy on weakness against 1.4800.
Instrument
|
Support 2
|
Support 1
|
Spot
|
Resistance 1
|
Resistance 2
|
GBP/USD
|
*1.4800
|
1.4885
|
1.4940
|
1.5000
|
*1.5050
|
Focus Chart of the Day: USD/JPY
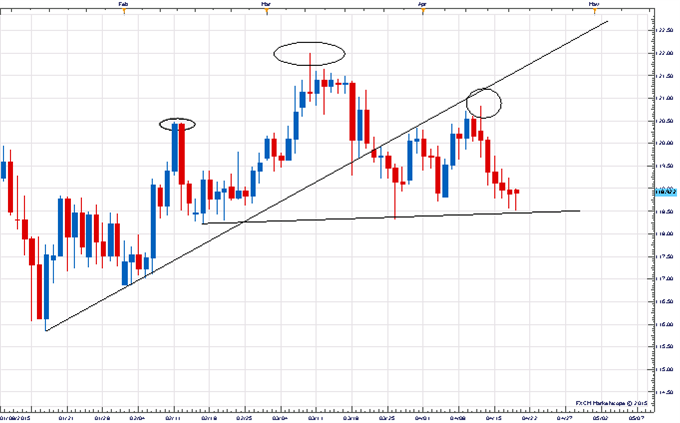
“Mainstream” analysts don’t seem to like chart patterns. This is a mistake in my view as chart patterns can give tremendous behavioral/psychological insight into an exchange rate. I am not the only who thinks this way apparently as even researchers at the Fed found them useful (albeit begrudgingly) in their rather infamous 1995 research piece “Head & Shoulders: Not Just A Flaky Pattern”. It can be read HERE. Personally I think where people run into trouble with pattern analysis is by trying to apply strict and rigid rules to them (which is ironically what the Fed researchers did). A pattern really is just showing a behavioral tendency after a set of technical occurrences. A “head & shoulders” pattern, for instance, is really just a development in a market where it has failed to record new highs. The “neckline” is just the point where a lot of short-term participants will bail out of long positions (or be forced to bail out if one acknowledges the self-fulfilling aspect of widely watched patterns). So why do I bring all this up today? USD/JPY - the price action since early February has set up a pretty clear potential head & shoulders pattern on the daily. Under 118.40 triggers.
No comments:
Post a Comment