Talking Points
- USD/JPY flirting with important downside pivots
- GBP/USD near key Fib zone
- USD/CAD breaks multi-week range
Get real time volume on your charts for free. Click HERE
Foreign Exchange Price & Time at a Glance:
Price & Time Analysis: USD/JPY
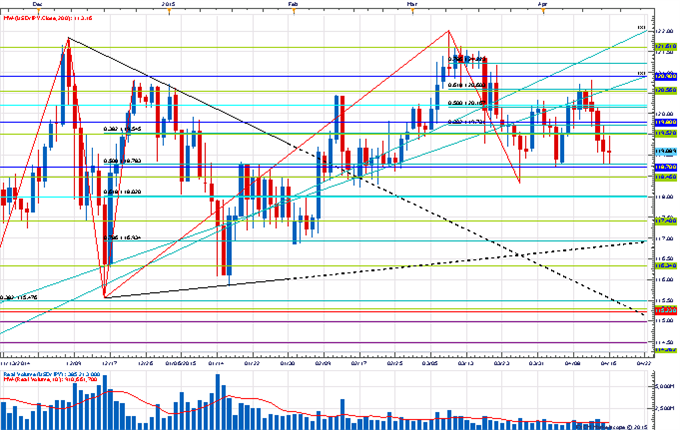
- USD/JPY has come under steady pressure since failing near the 61.8% retracement of the March range at the start of the week
- Our near-term trend bias is lower while below 120.90
- Gann levels at 118.70 and 118.40 look critical and a move below them is needed to spark a more serious decline
- A minor turn window is eyed today/tomorrow
- Only a move through 120.90 would turn us positive on the exchange rate
USD/JPY Strategy: Like the short side while under 120.90.
Instrument
|
Support 2
|
Support 1
|
Spot
|
Resistance 1
|
Resistance 2
|
USD/JPY
|
*118.40
|
118.70
|
119.10
|
119.50
|
*120.90
|
Price & Time Analysis: GBP/USD
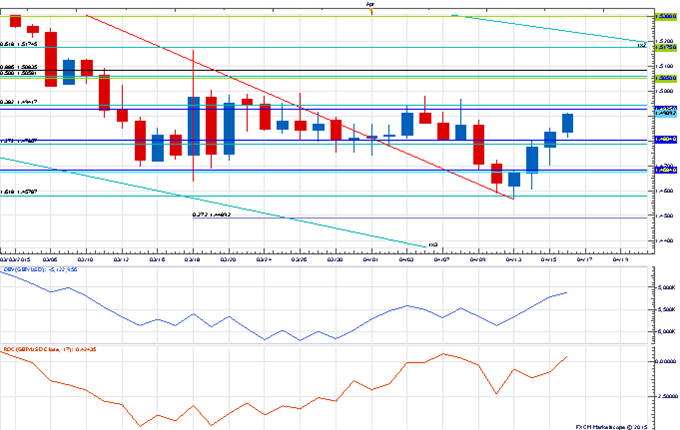
- GBP/USD has traded steadily higher since finding support earlier this week at the 261.8% extension of the January/February advance
- Our near-term trend bias is now higher in Cable
- The 38% retracement of the February/April decline at 1.4940 looks to be a key pivot with traction above needed to spark a more important leg higher
- A very minor turn window is eyed tomorrow
- A daily close under 1.4680 would turn us negative on the pound
GBP/USD Strategy: Looking to buy on weakness.
Instrument
|
Support 2
|
Support 1
|
Spot
|
Resistance 1
|
Resistance 2
|
GBP/USD
|
*1.4680
|
1.4800
|
1.4915
|
*1.4940
|
1.5050
|
Focus Chart of the Day: USD/CAD
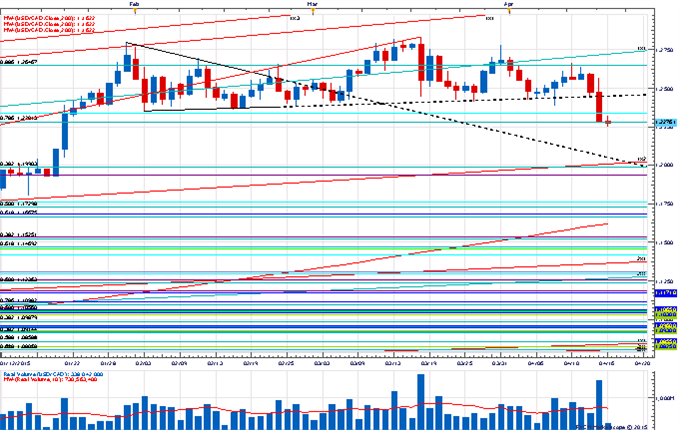
We have been suspicious of the action in USD/CAD since the dramatic reversal on the FOMC decision last month. It was one of the widest daily ranges in years on some of the highest volume in years. A textbook sign of exhaustion – especially after just eeking out a new high. Our fears were realized yesterday as the February lows were breached leading to another high volume liquidation. We can only assume that this decline has more to run given the clear potential overhang of “stale longs” after several weeks of range trade. Another interpretation of the price action is that a head & shoulders pattern has been triggered on the move through 1.2450. If this is the case, it could open the way for a move to 1.2000. We shall see. It is USD/CAD after all and a curve ball or two is the rule not the exception. Immediate resistance is seen at 1.2350 and 1.2450, but only a move over 1.2665 would turn the technical outlook positive.
No comments:
Post a Comment